How to set up monitoring for your Mastodon instance with Prometheus and Grafana
January 11, 2023
I’m not much of a “server person”. But there’s no escaping servers and cloud if you are serious about working in technology. Applications and data live in the cloud, and it’s always good to have understanding of how it works, even if you mostly work on the client side.
Recent surge of interest in Mastodon took me to setting up some instances and helping to operate them–some on my own, and some as part of a group. Such projects are a useful vehicle to learn new things in the context of a real application, and one of the areas I was interested in, is monitoring.
I went through the process of setting up monitoring for some Mastodon instances with Prometheus and Grafana. I haven’t worked with these systems before, so it was a basic crash course to me, which I think I somewhat passed, as I understand the basic concepts now. This post is mainly a set of notes and copypastable instructions for my future self, but there’s nothing secret here, and it may be of value to others too.
This material is largely based on the excellent series of blog posts by IPng Networks: part 1, part 2, part 3. That series assumes a bit more background knowledge and doesn’t cover the basics, like installing Grafana and Prometheus. So my post fills in some gaps in those.
Okay. Let’s dig in
Mental model of Grafana and Prometheus
Here is a naive explanation of what these are. Prometheus is a tool for collecting metrics, and Grafana displays those metrics on dashboards.
Here’s how I think about them.
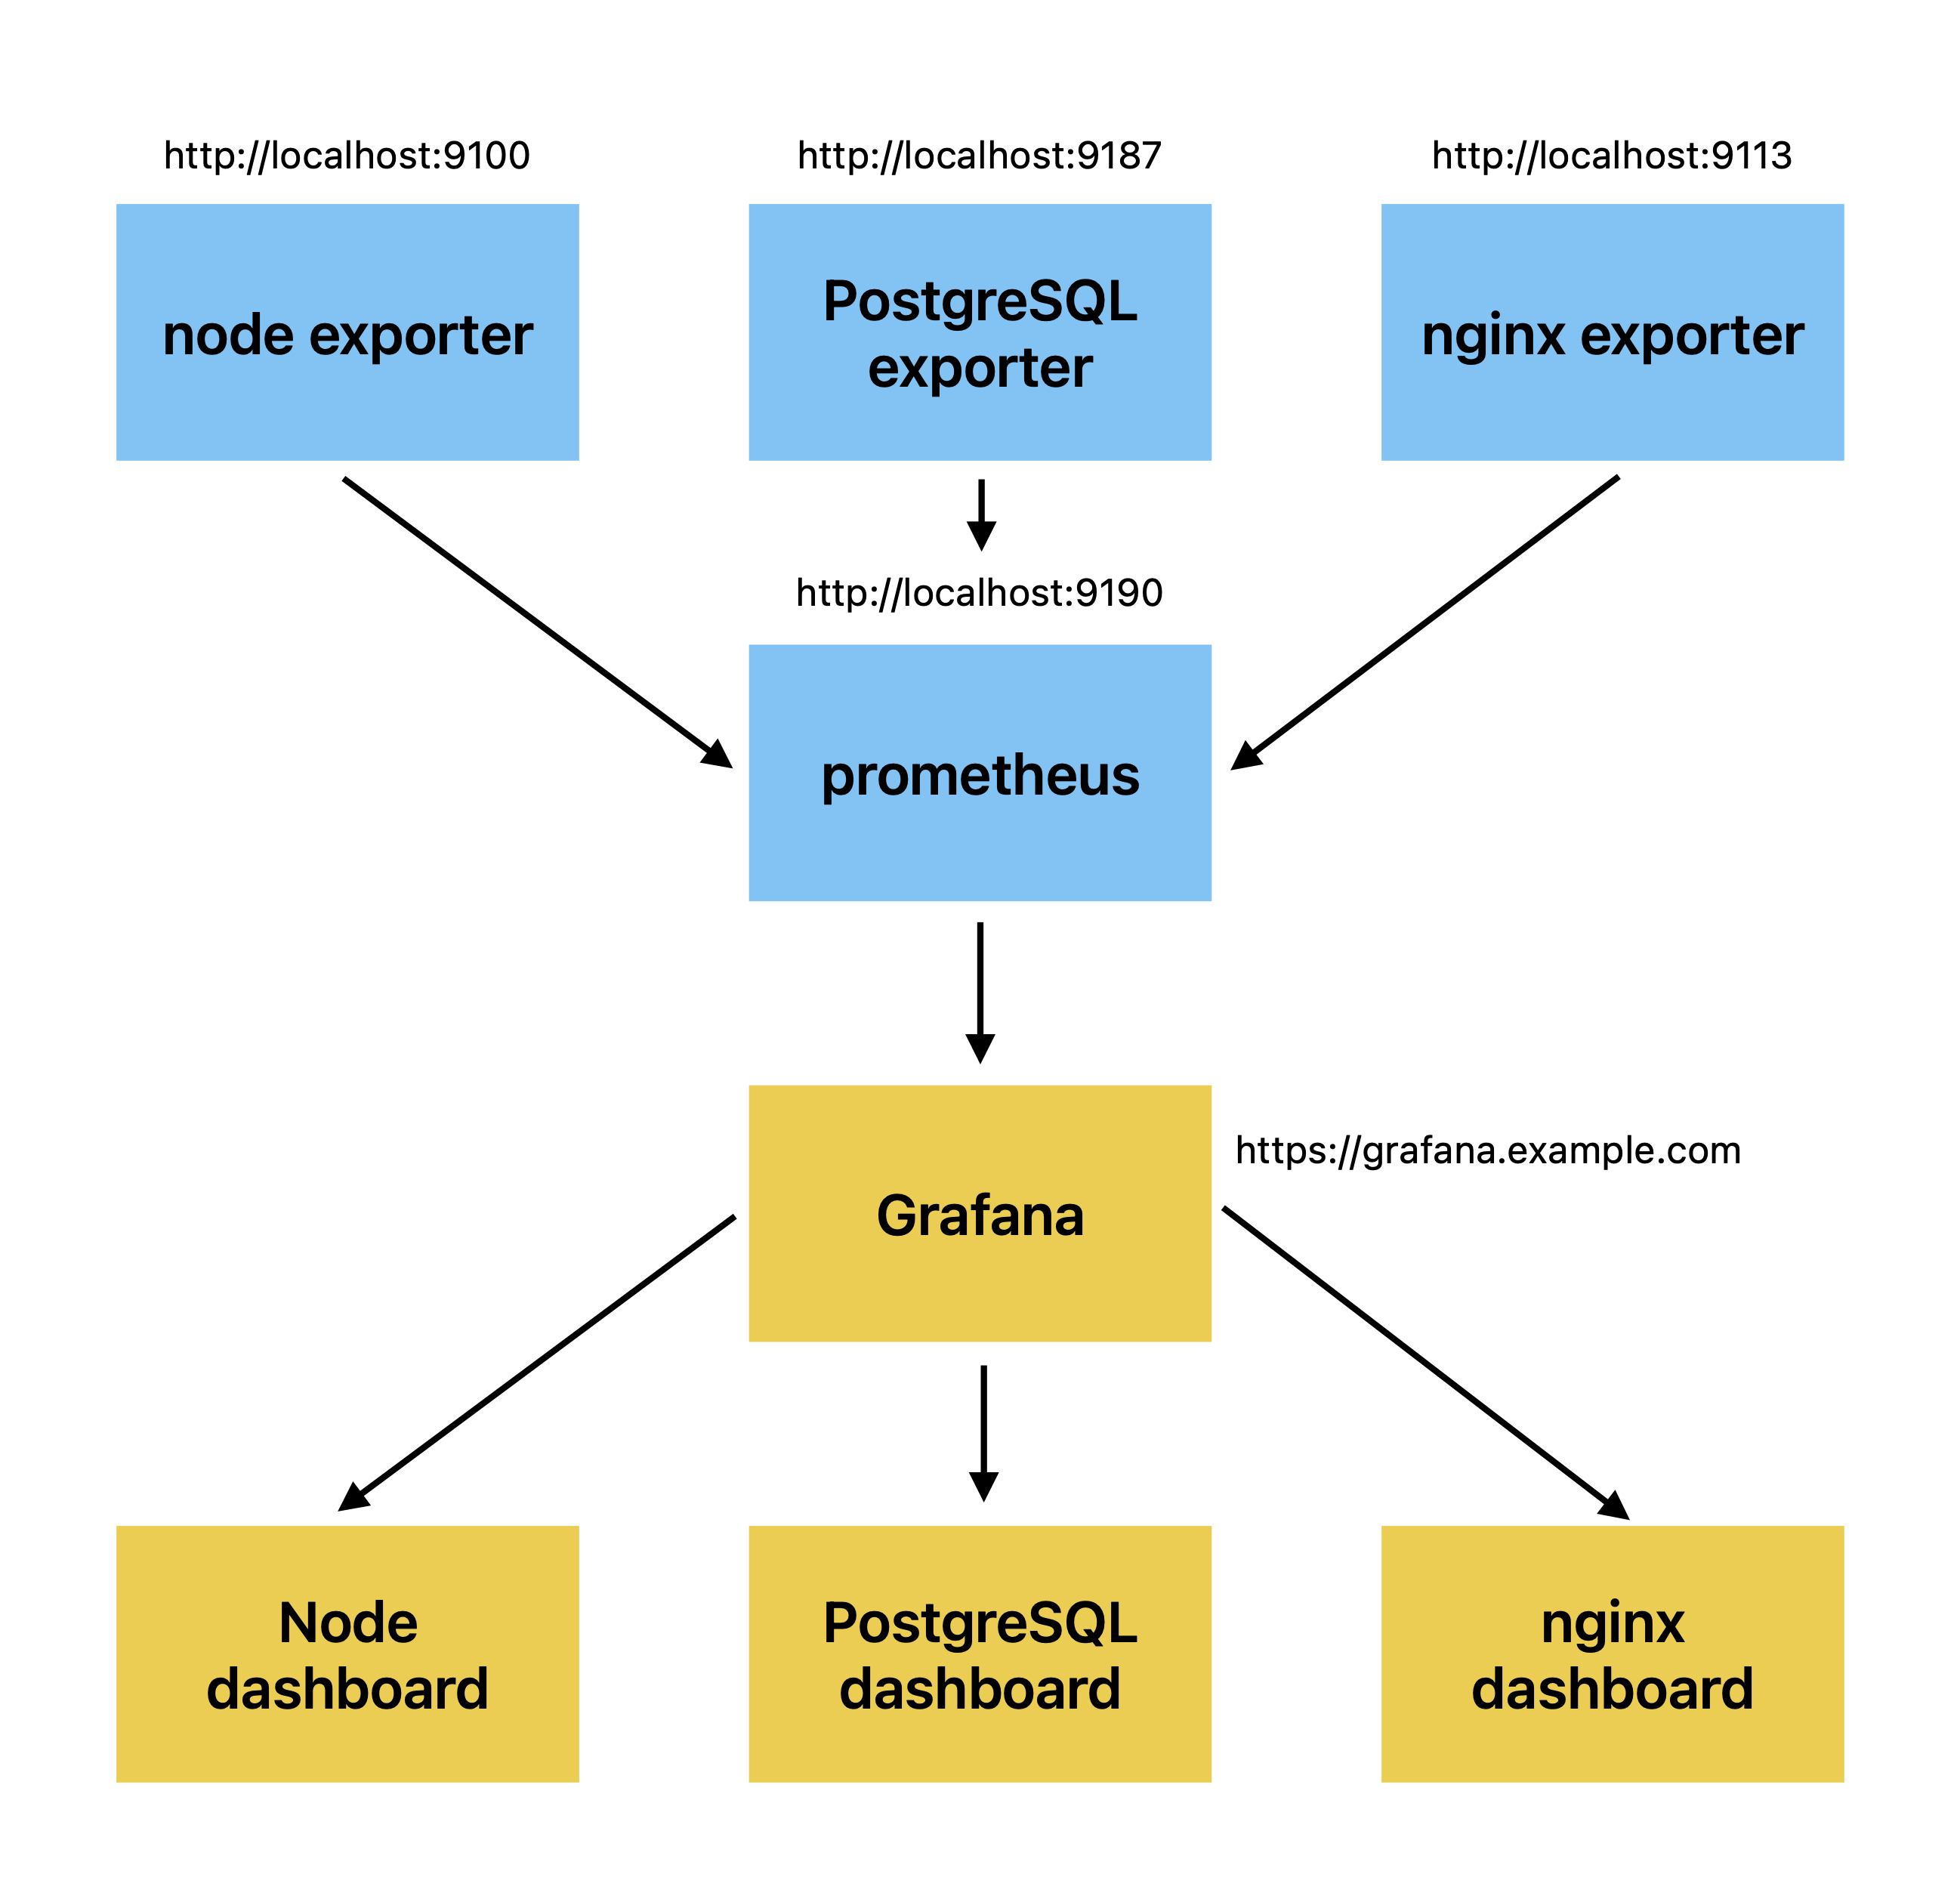
Prometheus has the concept of exporters - they export metrics about a particular application or subsystem from a particular host. One key exporter provided by Prometheus is node exporter. It has nothing to do with Node.js - it means “node” as in a physical machine instance (which may be really physical or a VM).
The exporters all run a small web server which exports metrics in specific text format. There is a list of canonical port allocations for exporters.
Next, there is a central “prometheus” agent, which collects and stores metrics from the individual exporters, and exposes yet another small web server. Prometheus also has its own web UI to visualize the metrics, but I won’t look at that since I’ll use Grafana.
Grafana can consume data from many sources, with Prometheus being one (and in this post, the only) source. It visualizes the data as dashboards. It can do many other thigns like generate alerts, which is not covered in this post.
This was a very quick and naive explanation to help establish a basic mental model. These systems have a lot more depth which is beyond the scope of this basic post.
So with the basic mental model in place, let’s install some software.
Starting point
I assume the following starting point.
- I have a Ubuntu host running Mastodon.
- I have superuser access on the host, and know how to run some basic Linux configuration and sudo. (If I already got Mastodon up and running, I am more than covered here.)
- I will install all monitoring on the same host.
Install Grafana
Let’s get an empty Grafana up and running before we fill it with data. Grafana is present in many APT repositories, but the version of Grafana that comes from my hosting provider is very old. Fortunately, Grafana provides its own APT repository. Follow the instructions here. I chose to install the open source version.
Now, you follow the instructions, you start the daemon, the server is running… or is it? How do you know?
Here is one important command you should use throughout this setup process: sudo lsof -nP | grep LISTEN. This shows all applications that are listening on some ports. I mentioned above that we’ll be installing a bunch of small web servers, and this is a good way to confirm they are actually running.
When you get to this point, and look for grafana in the list of running servers, you won’t see it at first. What is going on?
By default, both Grafana and Mastodon listen at port 3000. Since Mastodon is already running on that port, Grafana couldn’t, and fails to run.
To confirm this, here is another useful command: sudo journalctl -u grafana-server (replace “grafana-server” with whatever daemon you are interested in). You will likely see something like this.
Jan 11 08:01:35 example grafana-server[584534]: logger=server t=2023-01-11T08:01:35.790401765Z level=error msg="Stopped background service" service=*api.HTTPServer reason="failed to open listener on address 0.0.0.0:3000: listen tcp 0.0.0.0:3000: bind: address already in use"
Jan 11 08:01:35 example grafana-server[584534]: logger=secret.migration t=2023-01-11T08:01:35.796920608Z level=error msg="Stopped secret migration service" service=*migrations.DataSourceSecretMigrationService reason="context canceled"
Jan 11 08:01:35 example grafana-server[584534]: logger=infra.lockservice t=2023-01-11T08:01:35.797571767Z level=error msg="Failed to release the lock" error="context canceled"
Jan 11 08:01:35 example grafana-server[584534]: logger=server t=2023-01-11T08:01:35.798076811Z level=error msg="Server shutdown" error="*api.HTTPServer run error: failed to open listener on address 0.0.0.0:3000: listen tcp 0.0.0.0:3000: bind: address already in use"
Jan 11 08:01:35 example grafana-server[584534]: *api.HTTPServer run error: failed to open listener on address 0.0.0.0:3000: listen tcp 0.0.0.0:3000: bind: address already in use
Jan 11 08:01:35 example systemd[1]: grafana-server.service: Main process exited, code=exited, status=1/FAILURE
Jan 11 08:01:35 example systemd[1]: grafana-server.service: Failed with result 'exit-code'.
Jan 11 08:01:36 example systemd[1]: grafana-server.service: Scheduled restart job, restart counter is at 5.
Jan 11 08:01:36 example systemd[1]: Stopped Grafana instance.
Jan 11 08:01:36 example systemd[1]: grafana-server.service: Start request repeated too quickly.
Jan 11 08:01:36 example systemd[1]: grafana-server.service: Failed with result 'exit-code'.
Jan 11 08:01:36 example systemd[1]: Failed to start Grafana instance.
To fix this, edit /etc/grafana/grafana.ini. Add some port where there isn’t anything running already, for example 3100:
# The http port  to use
http_port = 3100
Restart the server with sudo systemctl restart grafana-server. You should now see it in the list of servers:
sudo lsof -nP | grep LISTEN

…
grafana-s 584598                           grafana    9u     IPv6            5587781       0t0        TCP *:3100 (LISTEN)
grafana-s 584598 584607 grafana-s          grafana    9u     IPv6            5587781       0t0        TCP *:3100 (LISTEN)
grafana-s 584598 584608 grafana-s          grafana    9u     IPv6            5587781       0t0        TCP *:3100 (LISTEN)
grafana-s 584598 584609 grafana-s          grafana    9u     IPv6            5587781       0t0        TCP *:3100 (LISTEN)
grafana-s 584598 584610 grafana-s          grafana    9u     IPv6            5587781       0t0        TCP *:3100 (LISTEN)
grafana-s 584598 584611 grafana-s          grafana    9u     IPv6            5587781       0t0        TCP *:3100 (LISTEN)
grafana-s 584598 584612 grafana-s          grafana    9u     IPv6            5587781       0t0        TCP *:3100 (LISTEN)
grafana-s 584598 584613 grafana-s          grafana    9u     IPv6            5587781       0t0        TCP *:3100 (LISTEN)
grafana-s 584598 584614 grafana-s          grafana    9u     IPv6            5587781       0t0        TCP *:3100 (LISTEN)
grafana-s 584598 584615 grafana-s          grafana    9u     IPv6            5587781       0t0        TCP *:3100 (LISTEN)
grafana-s 584598 584616 grafana-s          grafana    9u     IPv6            5587781       0t0        TCP *:3100 (LISTEN)
Install nginx frontend for Grafana
Your Grafana isn’t available from the public Internet. Or at least shouldn’t be. Check that you can’t publicly access http://grafana.example.com:3100. If you can, use some firewall or network configuration on your host or hosting provider to limit access to this port from the public Internet.
A common practice for public servers is to have nginx frontend which does HTTPS termination and reverse-proxies to the actual application. This is also what Mastodon itself does. We will now do this for Grafana.
I will walk through the nginx host setup in typical steps.
First, update your DNS to point grafana.example.com to the IP of this server.
Next, add grafana into /etc/nginx/sites-available, with the following content:
server {
  listen 80;
  listen [::]:80;
  root /var/www/html;
  server_name grafana.example.com;
  index index.html index.htm index.nginx-debian.html;
  location / {
    # First attempt to serve request as file, then
    # as directory, then fall back to displaying a 404.
    try_files $uri $uri/ =404;
  }
}
Link it to /etc/nginx/sites-enabled. Test your configuration: sudo nginx -t. If it looks OK, restart nginx. sudo nginx -s reload. You should now see a default site when you go to http://grafana.example.com.
Now, add HTTPS to the site. Easiest is to use Let’s Encrypt, and have their certbot do all the work. Run sudo certbot and follow the prompts. This sets up HTTPS certificates for grafana, as well as the automatic cetificate rotation (Let’s Encrypt certificates are short-lived and must be automatically rotated). When you did this correctly, you can now go to https://grafana.example.com and see a default site, served correctly over HTTPS without warnings.
Finally, set up the reverse proxy from nginx. Here’s what I use, and what your /etc/nginx/sites-available/grafana should look like in the end.
server {

  server_name grafana.example.com;

  location / {
    proxy_pass http://localhost:3100;
    proxy_http_version 1.1;
    proxy_set_header Upgrade $http_upgrade;
    proxy_set_header Connection 'upgrade';
    proxy_set_header Host $host;
    proxy_cache_bypass $http_upgrade;
  }

  listen [::]:443 ssl ipv6only=on; # managed by Certbot
  listen 443 ssl; # managed by Certbot
  ssl_certificate /etc/letsencrypt/live/grafana.example.com/fullchain.pem; # managed by Certbot
  ssl_certificate_key /etc/letsencrypt/live/grafana.example.com/privkey.pem; # managed by Certbot
  include /etc/letsencrypt/options-ssl-nginx.conf; # managed by Certbot
  ssl_dhparam /etc/letsencrypt/ssl-dhparams.pem; # managed by Certbot
}

server {
    if ($host = grafana.example.com) {
      return 301 https://$host$request_uri;
    } # managed by Certbot

    listen 80;
    listen [::]:80;

    server_name grafana.example.com;
    return 404; # managed by Certbot
}
Test your configuration: sudo nginx -t. Restart nginx: sudo nginx -s reload.
Launch Grafana, set up admin password and users
Finally you can start to see something in your browser. Go to https://grafana.example.com. You should see Grafana UI.
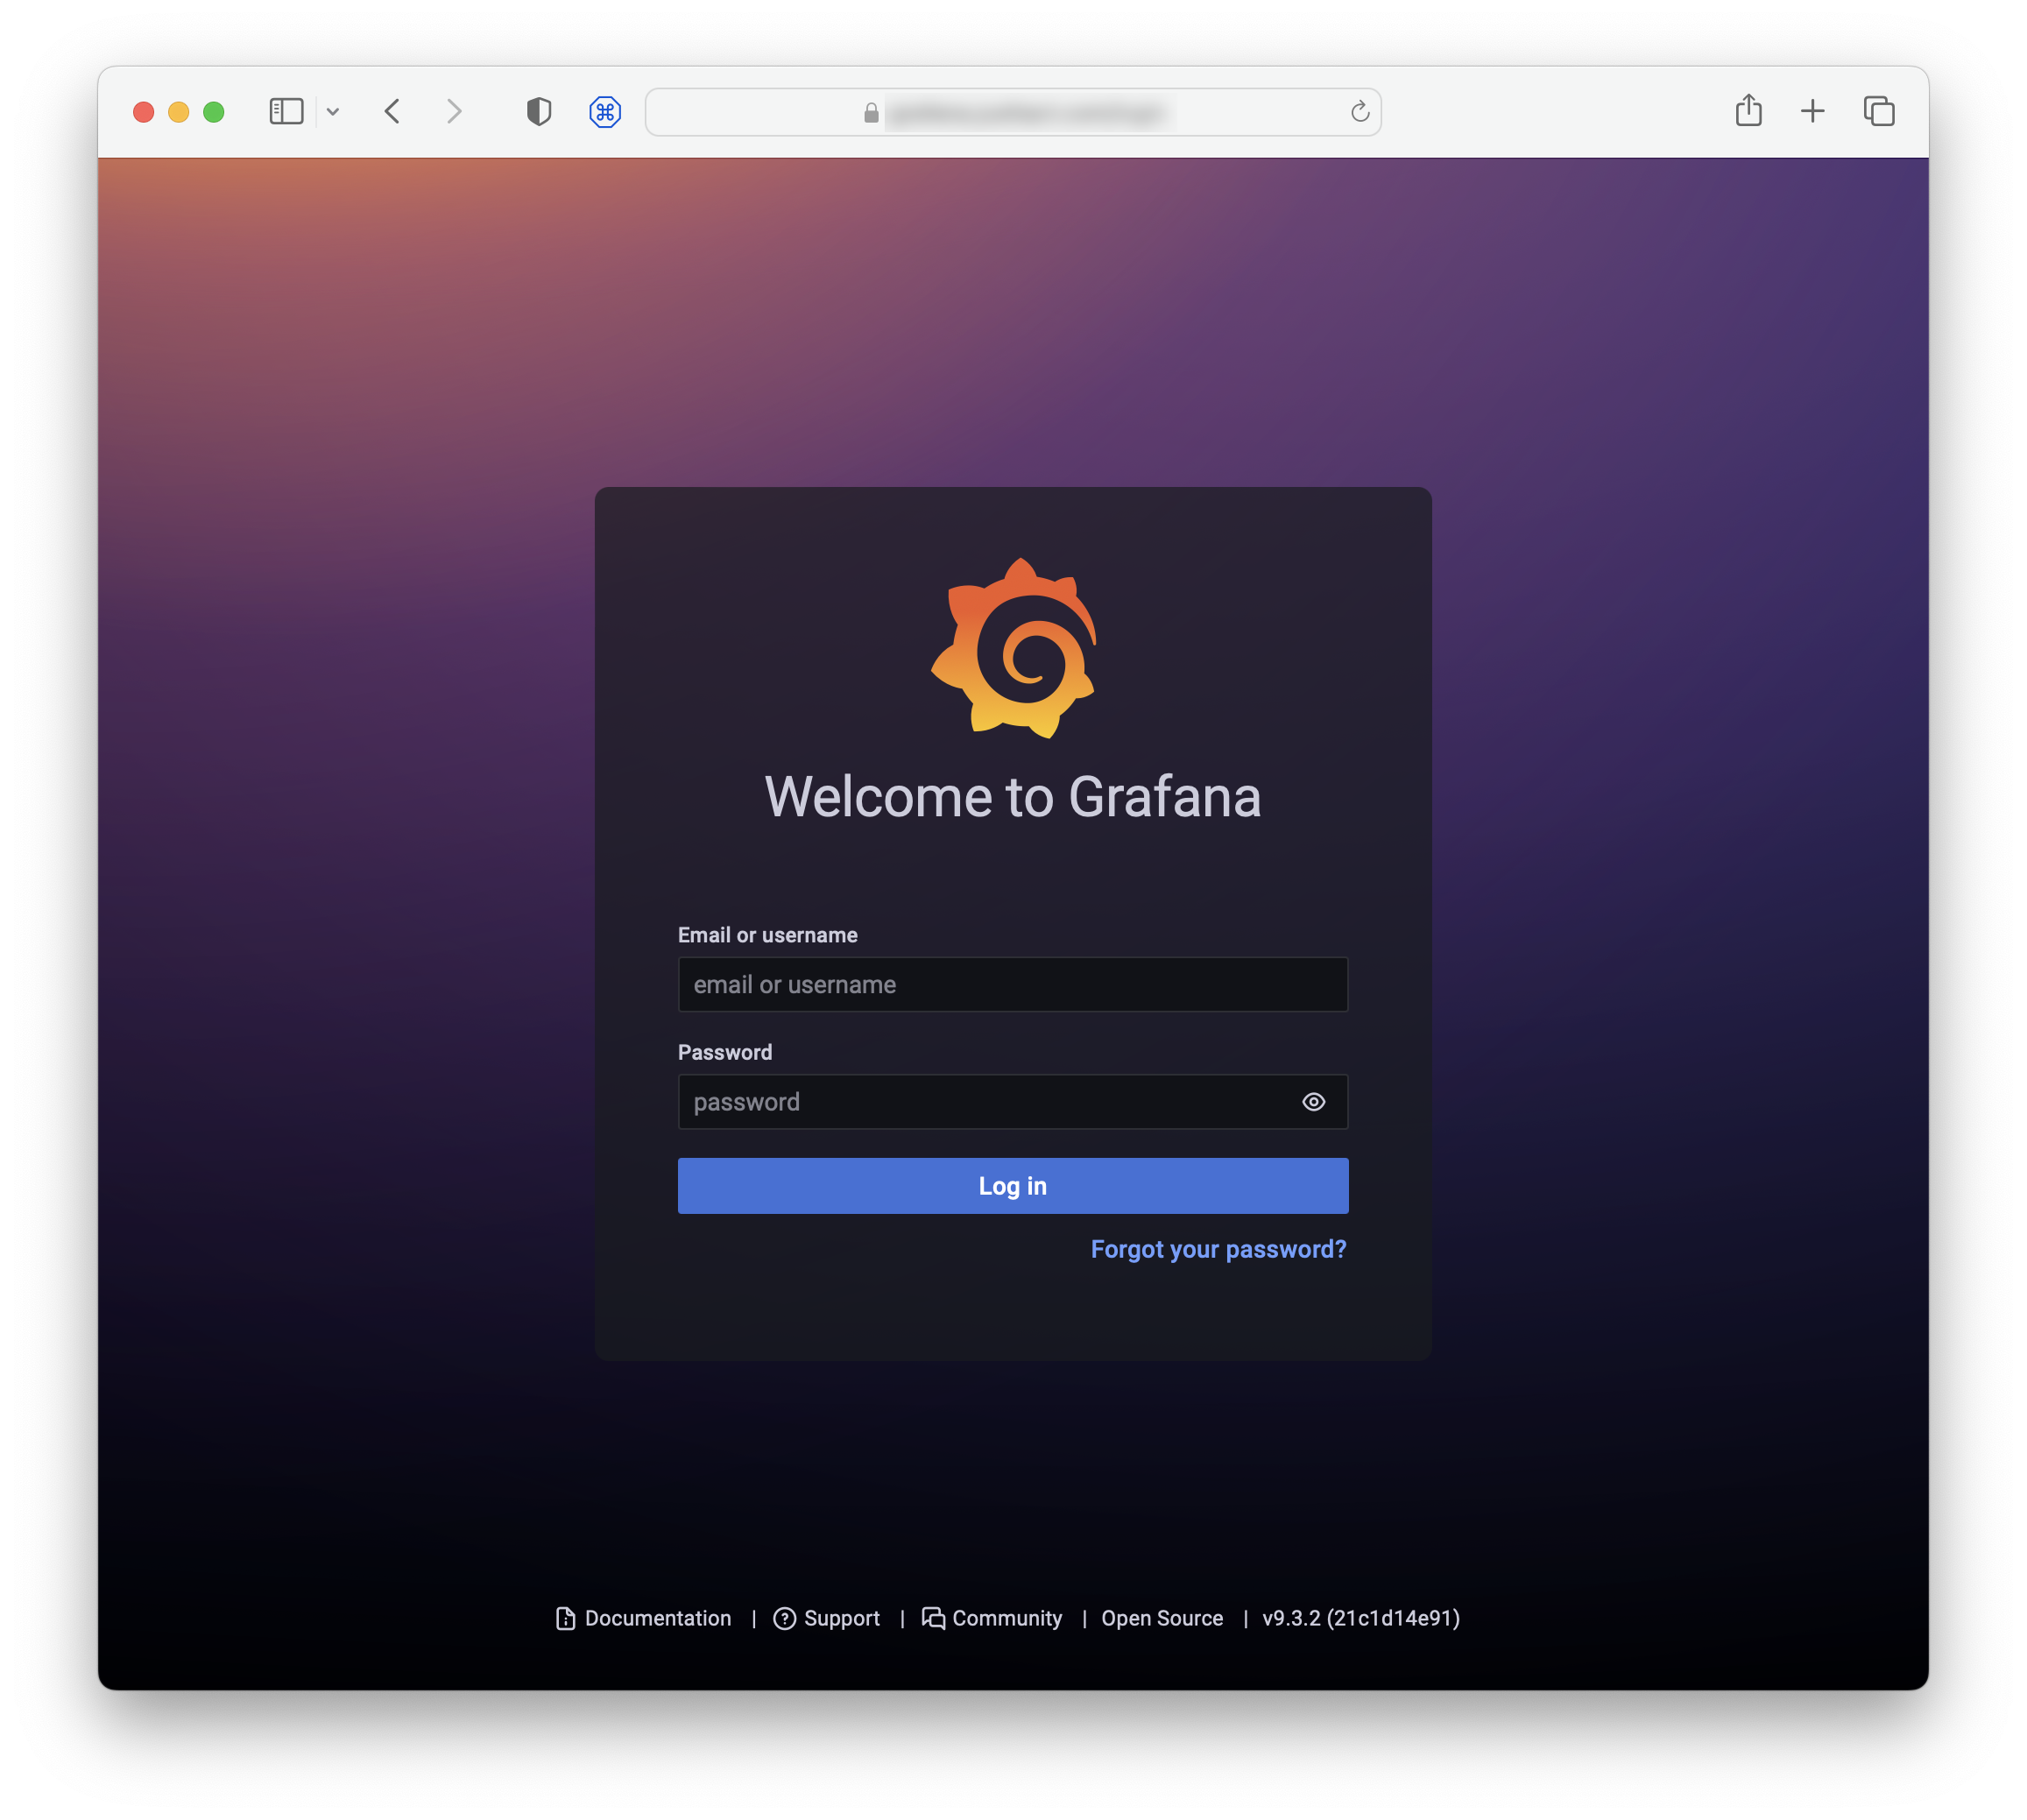
The first login is with user “admin” and password “admin”. It will prompt you to set a secure password. Do that. You can then continue using Grafana as admin, or set up another admin user for yourself. You can also invite more people. We haven’t set up e-mail sending in Grafana by this point, so e-mail invitations won’t work. Just copy the invitation links from the web UI and share those yourself.
Install Prometheus and node-exporter
Install Prometheus from latest official binary following these instructions. Ignore the part about “firewall rules opened for accessing Prometheus port 9090” because we won’t access Prometheus from public Internet.
You should now see that Prometheus is listening on your server:
sudo lsof -nP | grep LISTEN

…
prometheu 585995                        prometheus    7u     IPv6            5612824       0t0        TCP *:9090 (LISTEN)
prometheu 585995 585996 prometheu       prometheus    7u     IPv6            5612824       0t0        TCP *:9090 (LISTEN)
prometheu 585995 585997 prometheu       prometheus    7u     IPv6            5612824       0t0        TCP *:9090 (LISTEN)
prometheu 585995 585998 prometheu       prometheus    7u     IPv6            5612824       0t0        TCP *:9090 (LISTEN)
prometheu 585995 585999 prometheu       prometheus    7u     IPv6            5612824       0t0        TCP *:9090 (LISTEN)
prometheu 585995 586003 prometheu       prometheus    7u     IPv6            5612824       0t0        TCP *:9090 (LISTEN)
Install node_exporter from the official downloads page. (Replace the URL with the latest version.)
curl -OL https://github.com/prometheus/node_exporter/releases/download/v1.5.0/node_exporter-1.5.0.linux-amd64.tar.gz
tar xzvf node_exporter-1.5.0.linux-amd64.tar.gz
sudo cp node_exporter-1.5.0.linux-amd64/node_exporter /usr/local/bin
Create /etc/systemd/system/node_exporter.service with the following content:
[Unit]
Description=Node Exporter
After=network.target

[Service]
User=prometheus
Group=prometheus
Type=simple
ExecStart=/usr/local/bin/node_exporter

[Install]
WantedBy=multi-user.target
Add the service and check its status. All should look good:
sudo systemctl daemon-reload
sudo systemctl start node_exporter
sudo systemctl status node_exporter
You should now see the node metrics being exported. You can manually query the URL with curl and you’ll see a ton of metrics.
$ curl http://localhost:9100/metrics
# HELP go_gc_duration_seconds A summary of the pause duration of garbage collection cycles.
# TYPE go_gc_duration_seconds summary
go_gc_duration_seconds{quantile="0"} 0
go_gc_duration_seconds{quantile="0.25"} 0
go_gc_duration_seconds{quantile="0.5"} 0
go_gc_duration_seconds{quantile="0.75"} 0
go_gc_duration_seconds{quantile="1"} 0
go_gc_duration_seconds_sum 0
go_gc_duration_seconds_count 0
# HELP go_goroutines Number of goroutines that currently exist.
…
Add the newly added node_exporter to prometheus configuration. Edit /etc/prometheus/prometheus.yml and add this into scrape_configs:
- job_name: node
    # If prometheus-node-exporter is installed, grab stats about the local
    # machine by default.
    static_configs:
      - targets: ['localhost:9100']
Restart prometheus for the new configuration to take effect: sudo systemctl restart prometheus
Add your first Grafana dashboard
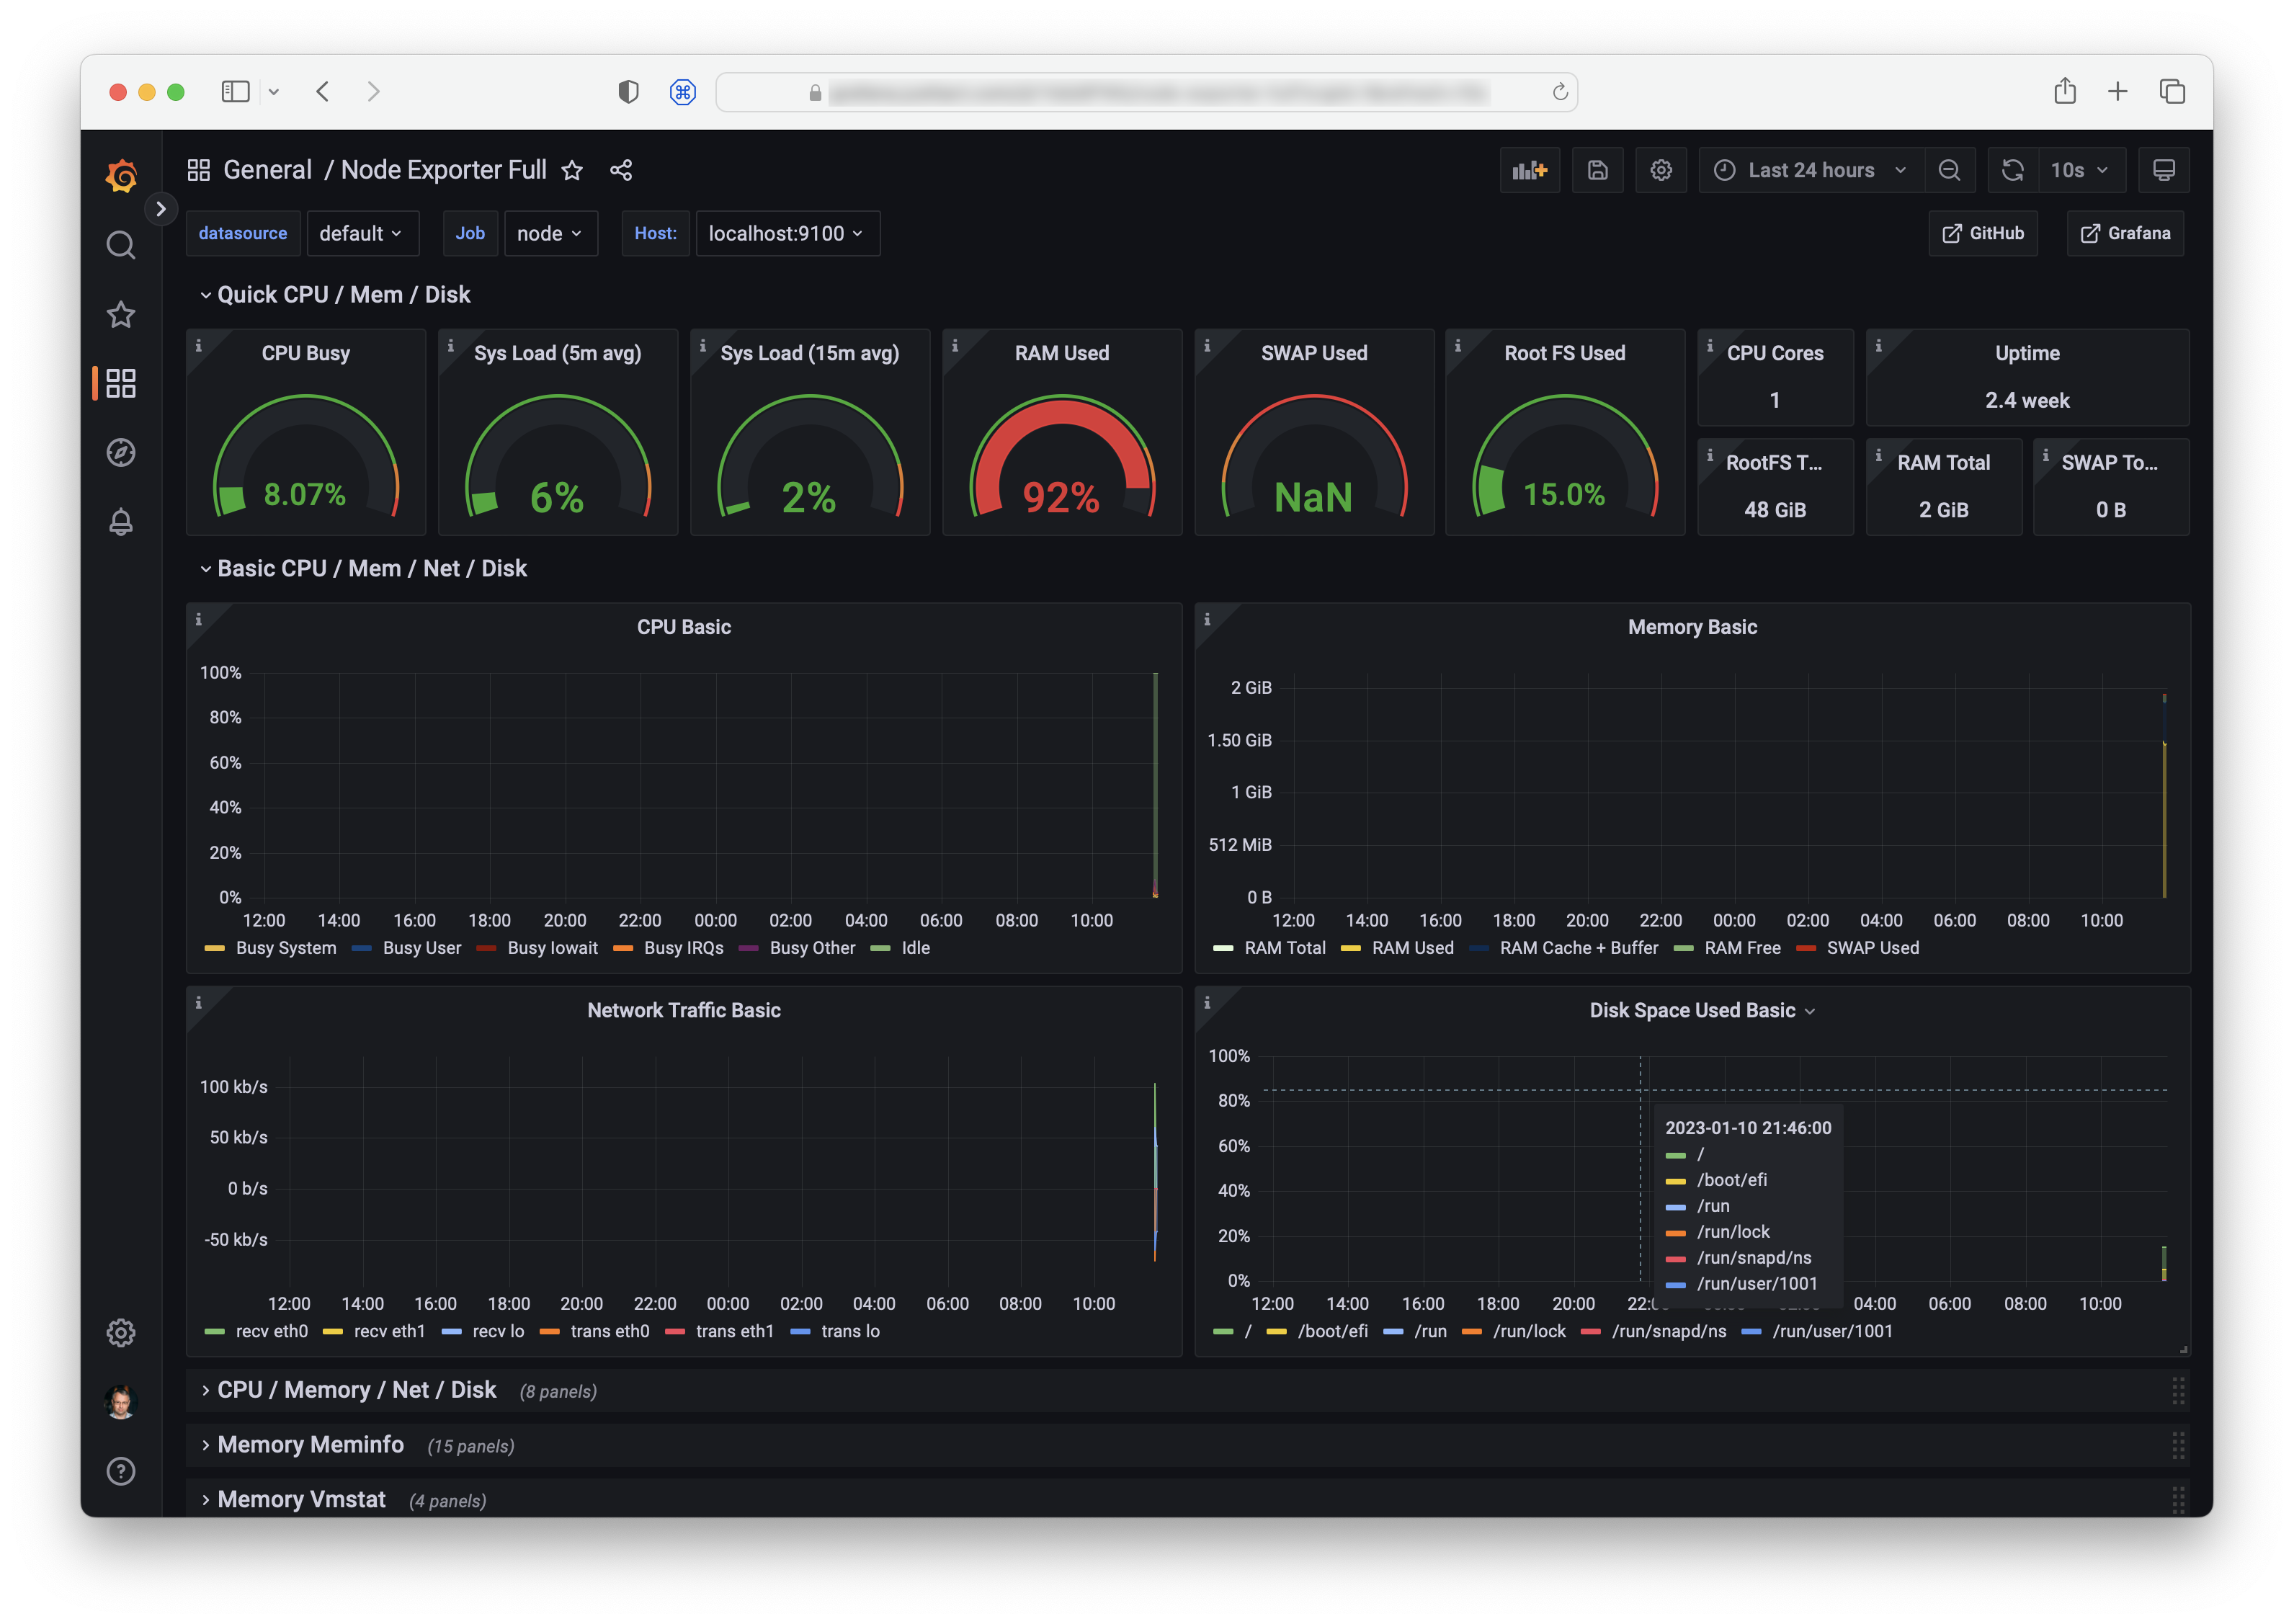
We have done a lot of work but not yet seeing any dashboards. Let’s add our first dashboard to Grafana which exposes metrics from the node exporter that you just set up.
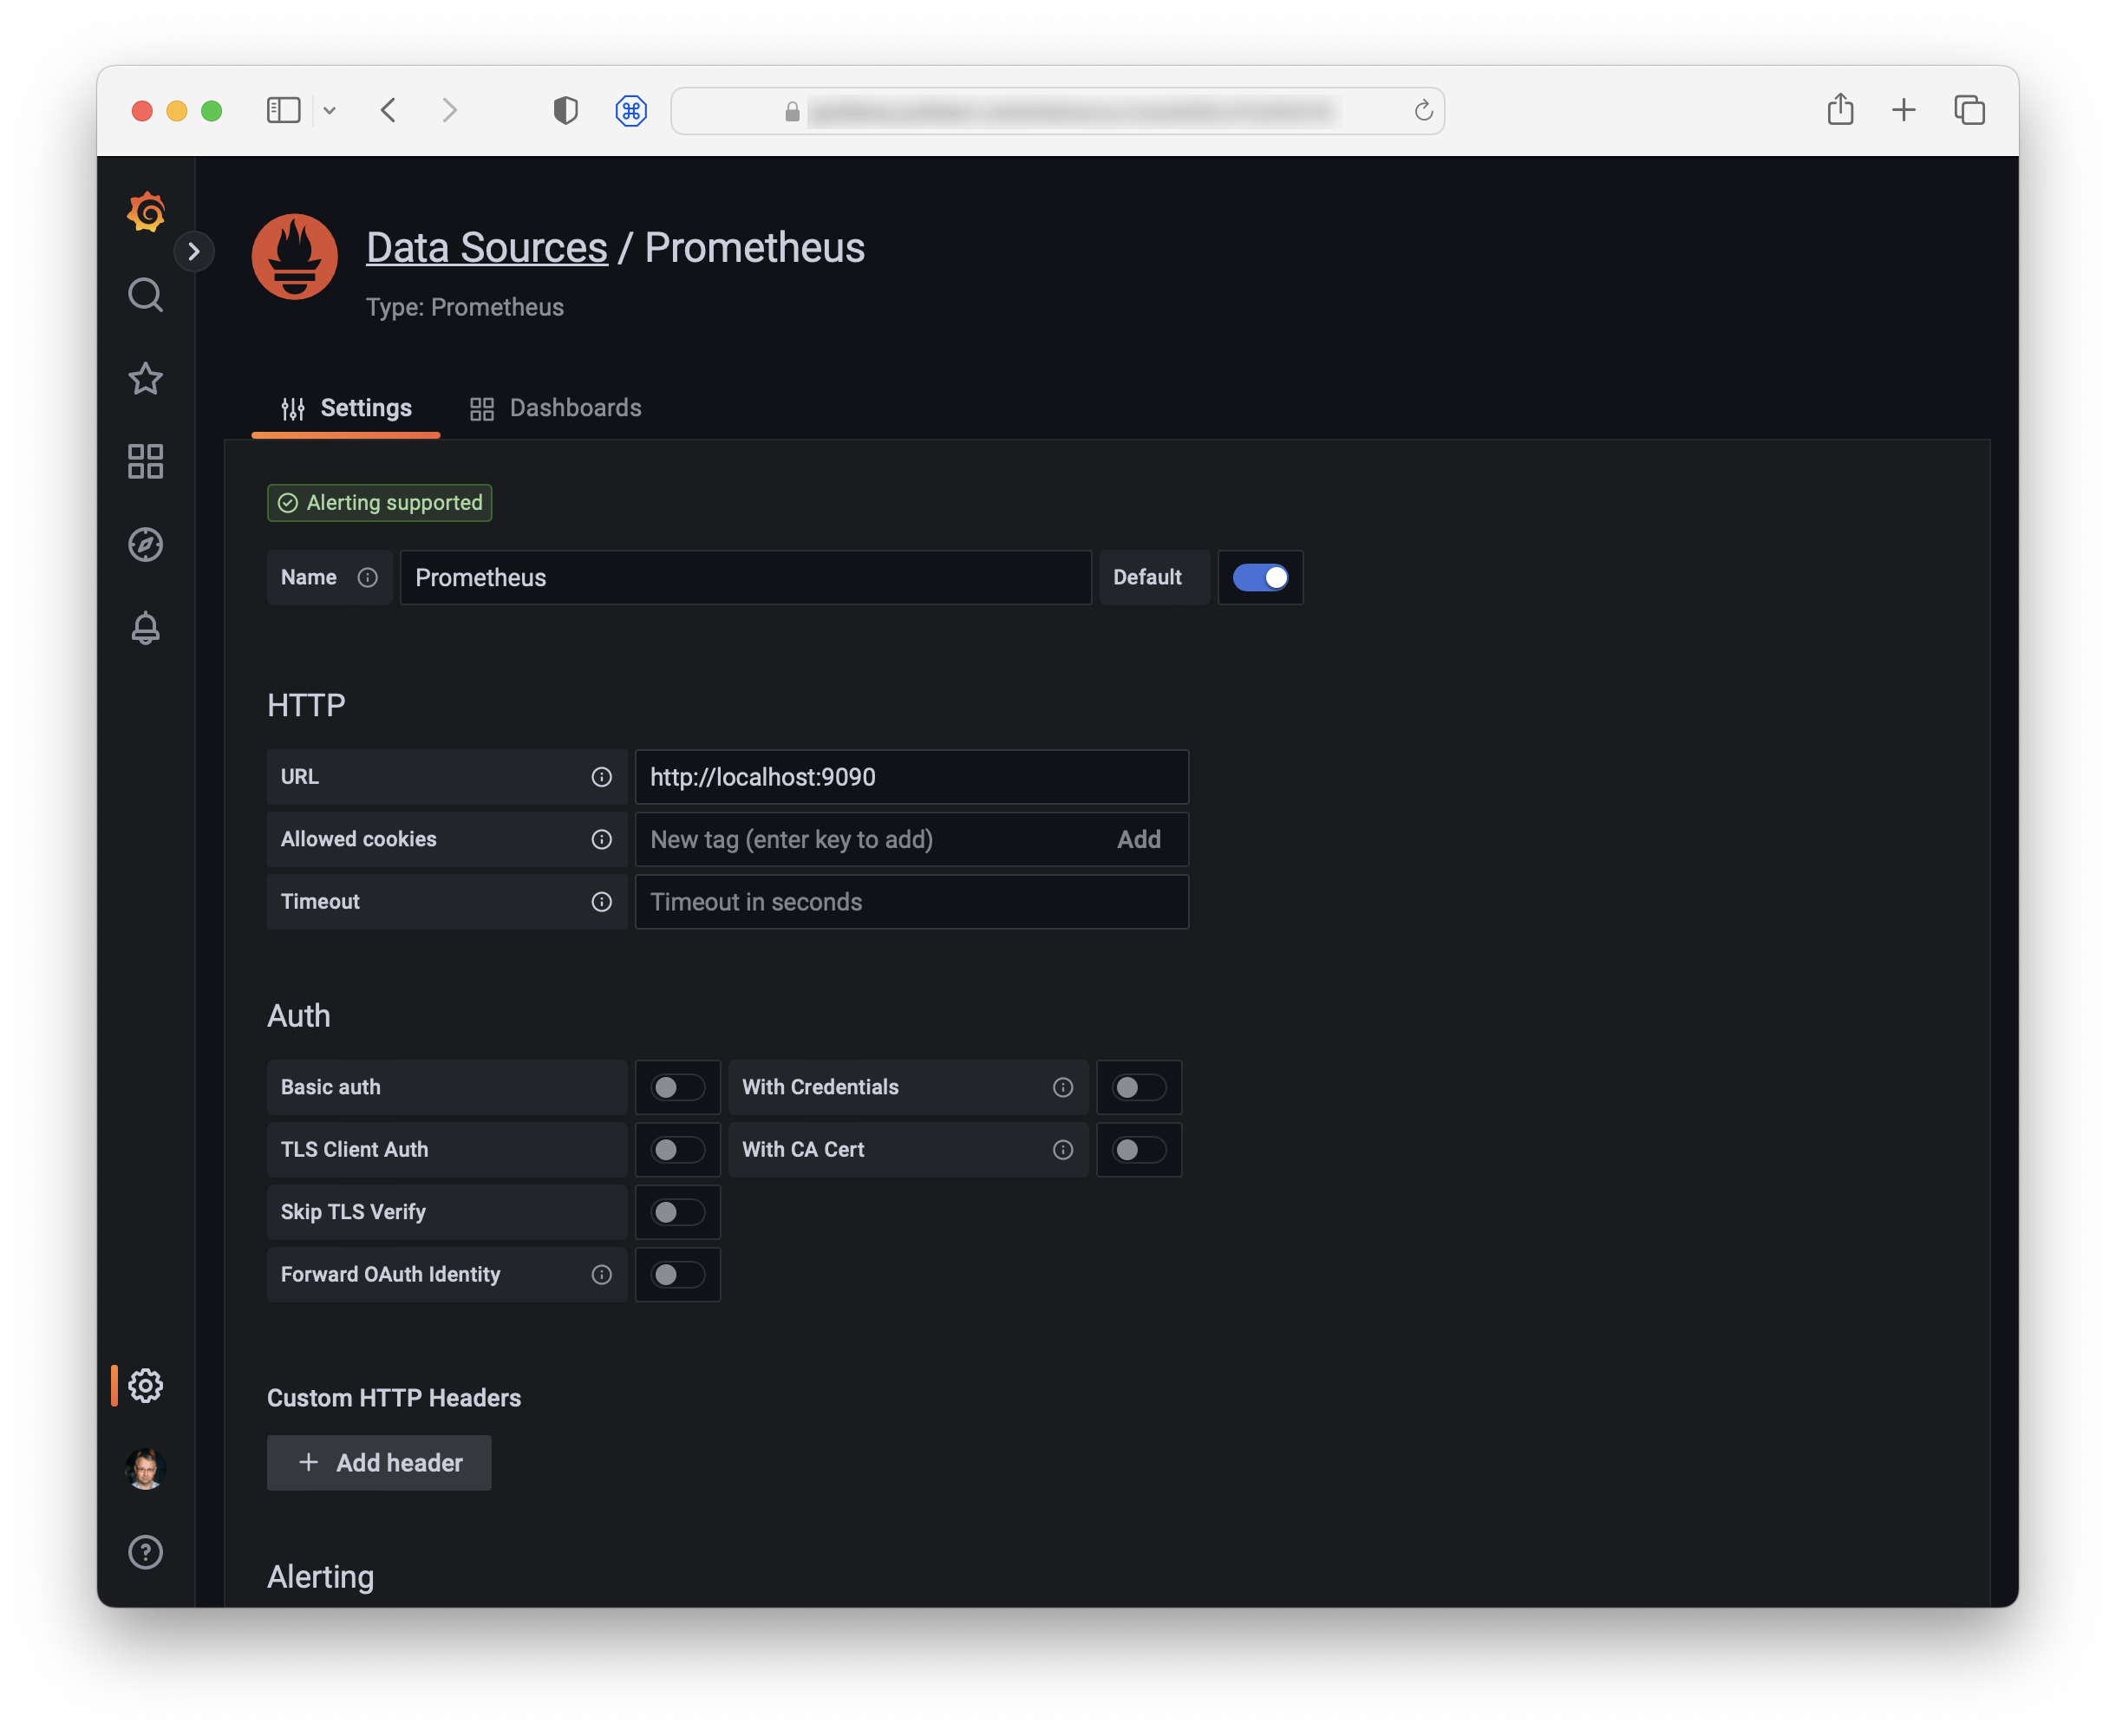
Go to https://grafana.example.com. Add Prometheus as data source. The only thing you need to enter here is the URL.
Add the dashboard. Select “Import dashboard” and add 1860 as the dashboard ID. This is the official full node_exporter dashboard.
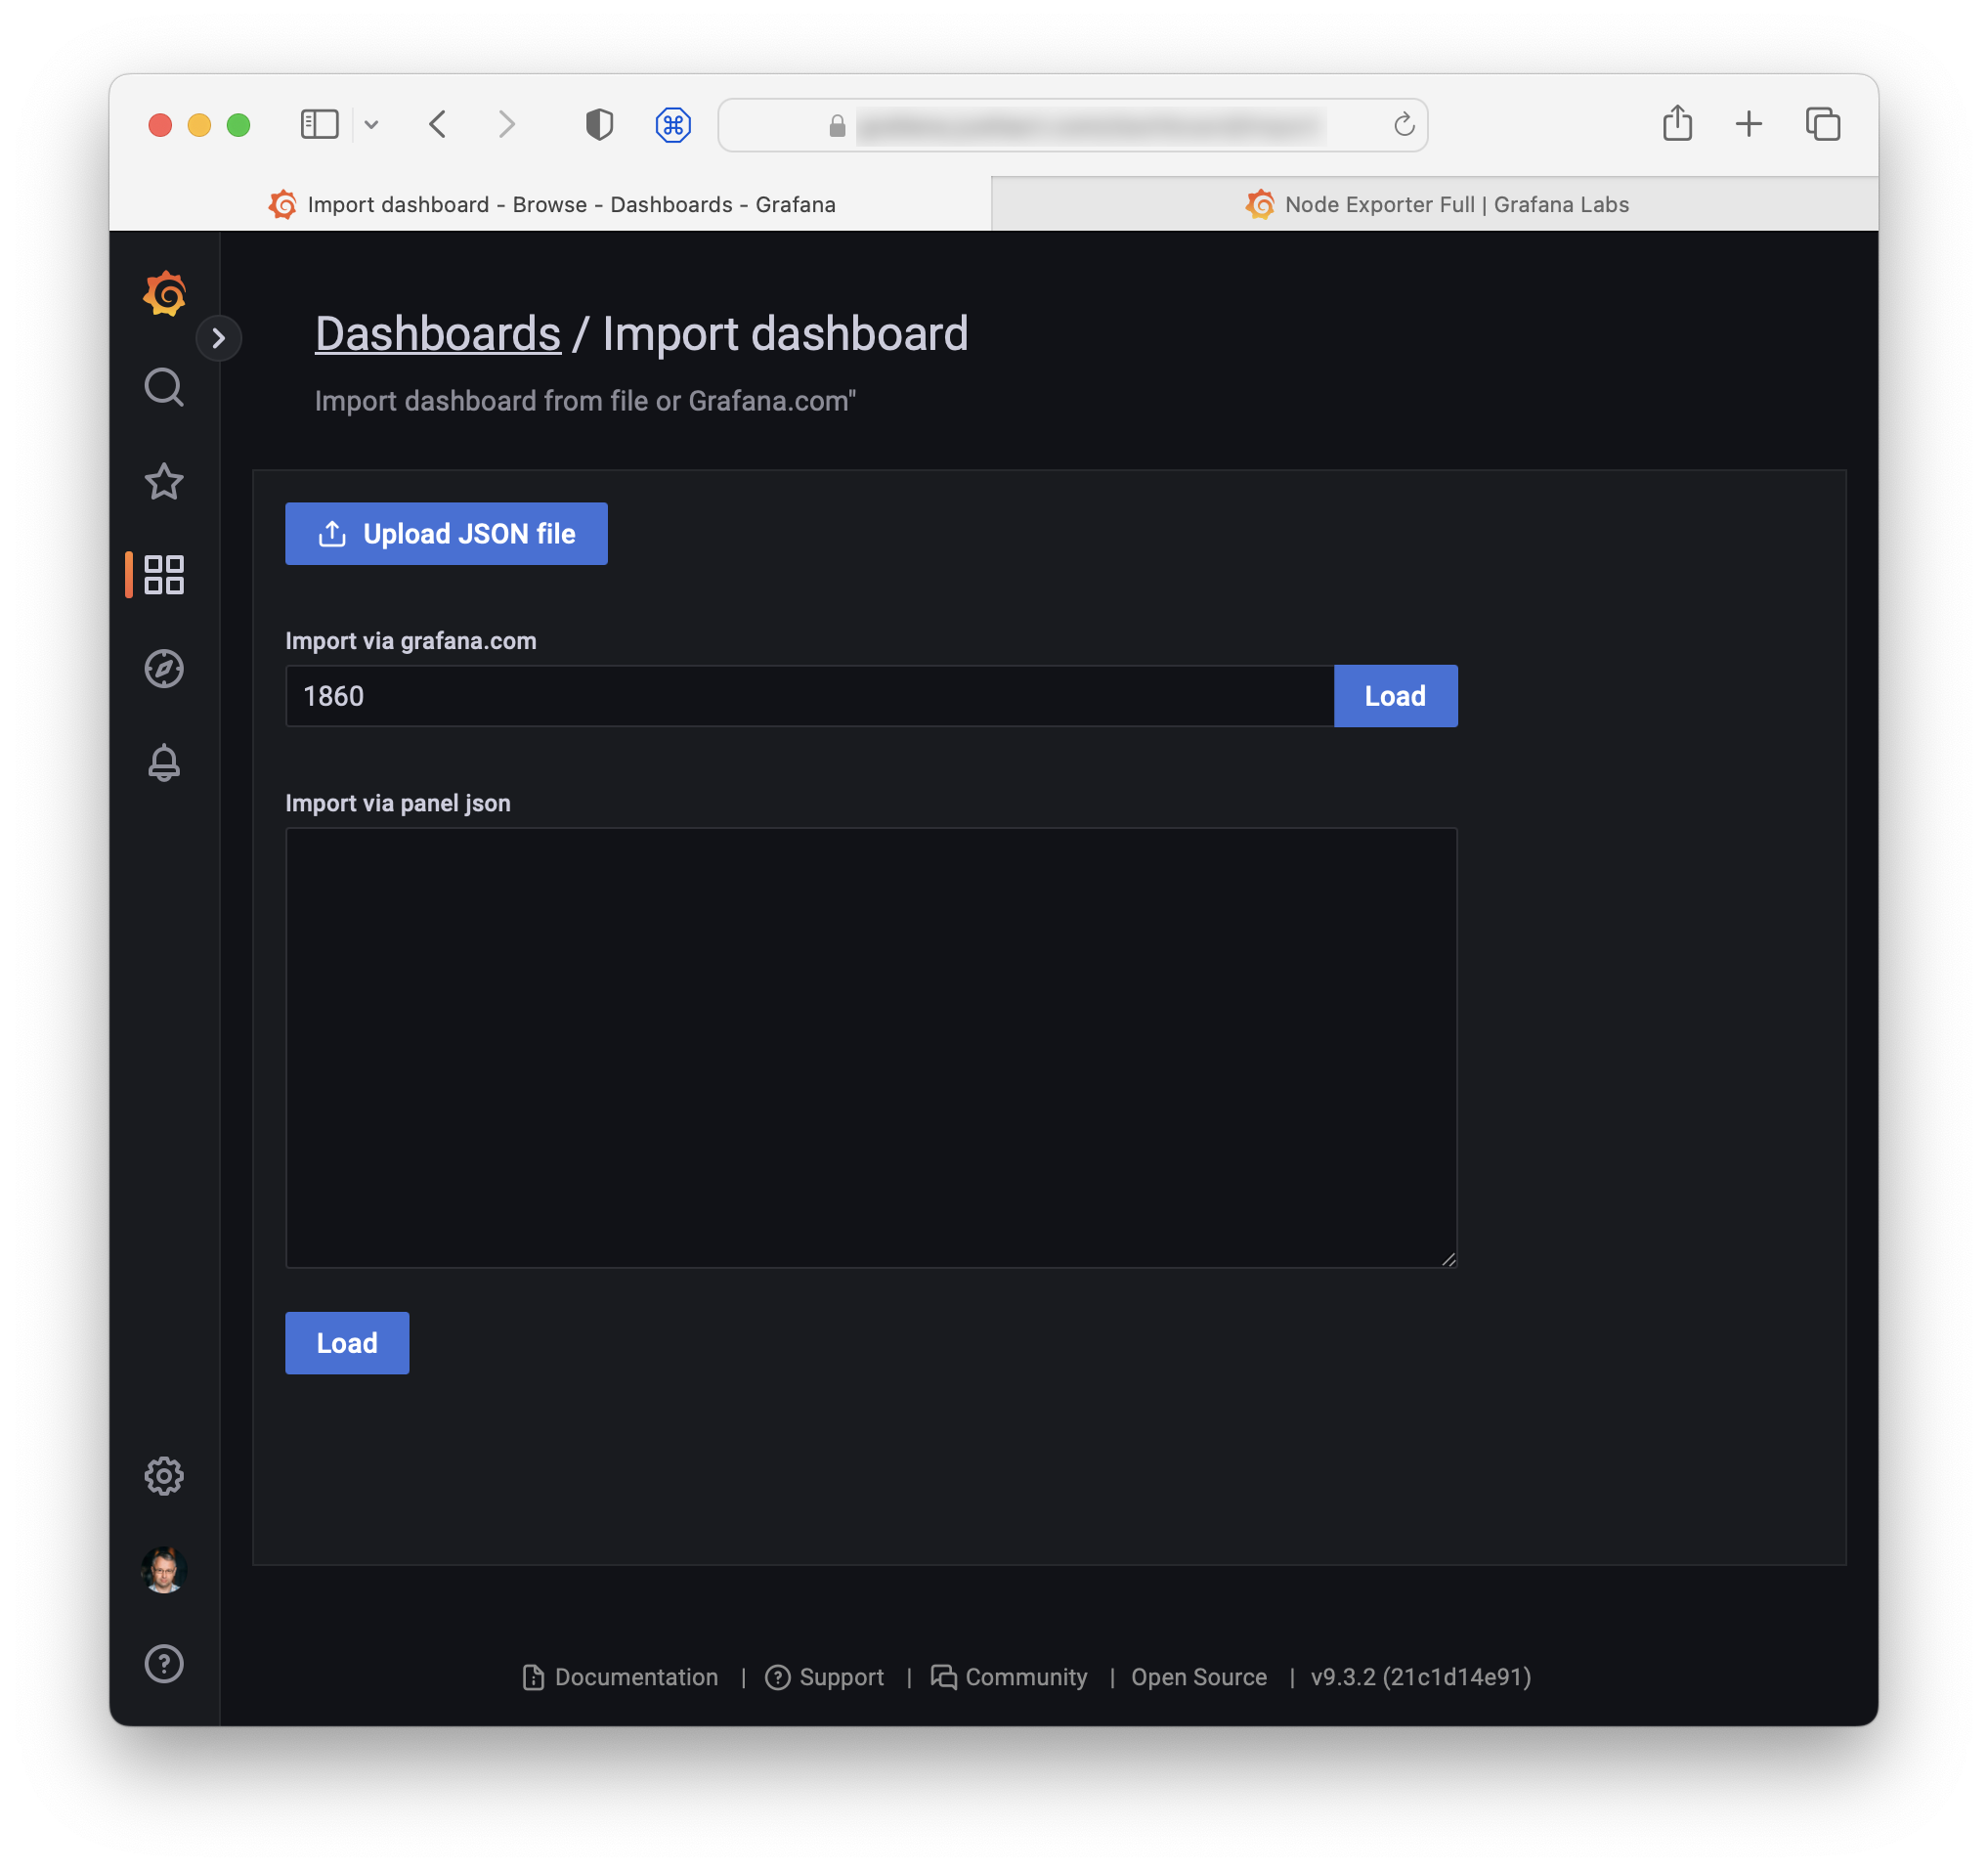
Click “Load”. In the next screen, select Prometheus as data source. Congratulations, you should now see your first dashboard.
Add Mastodon statsd exporter and dashboard
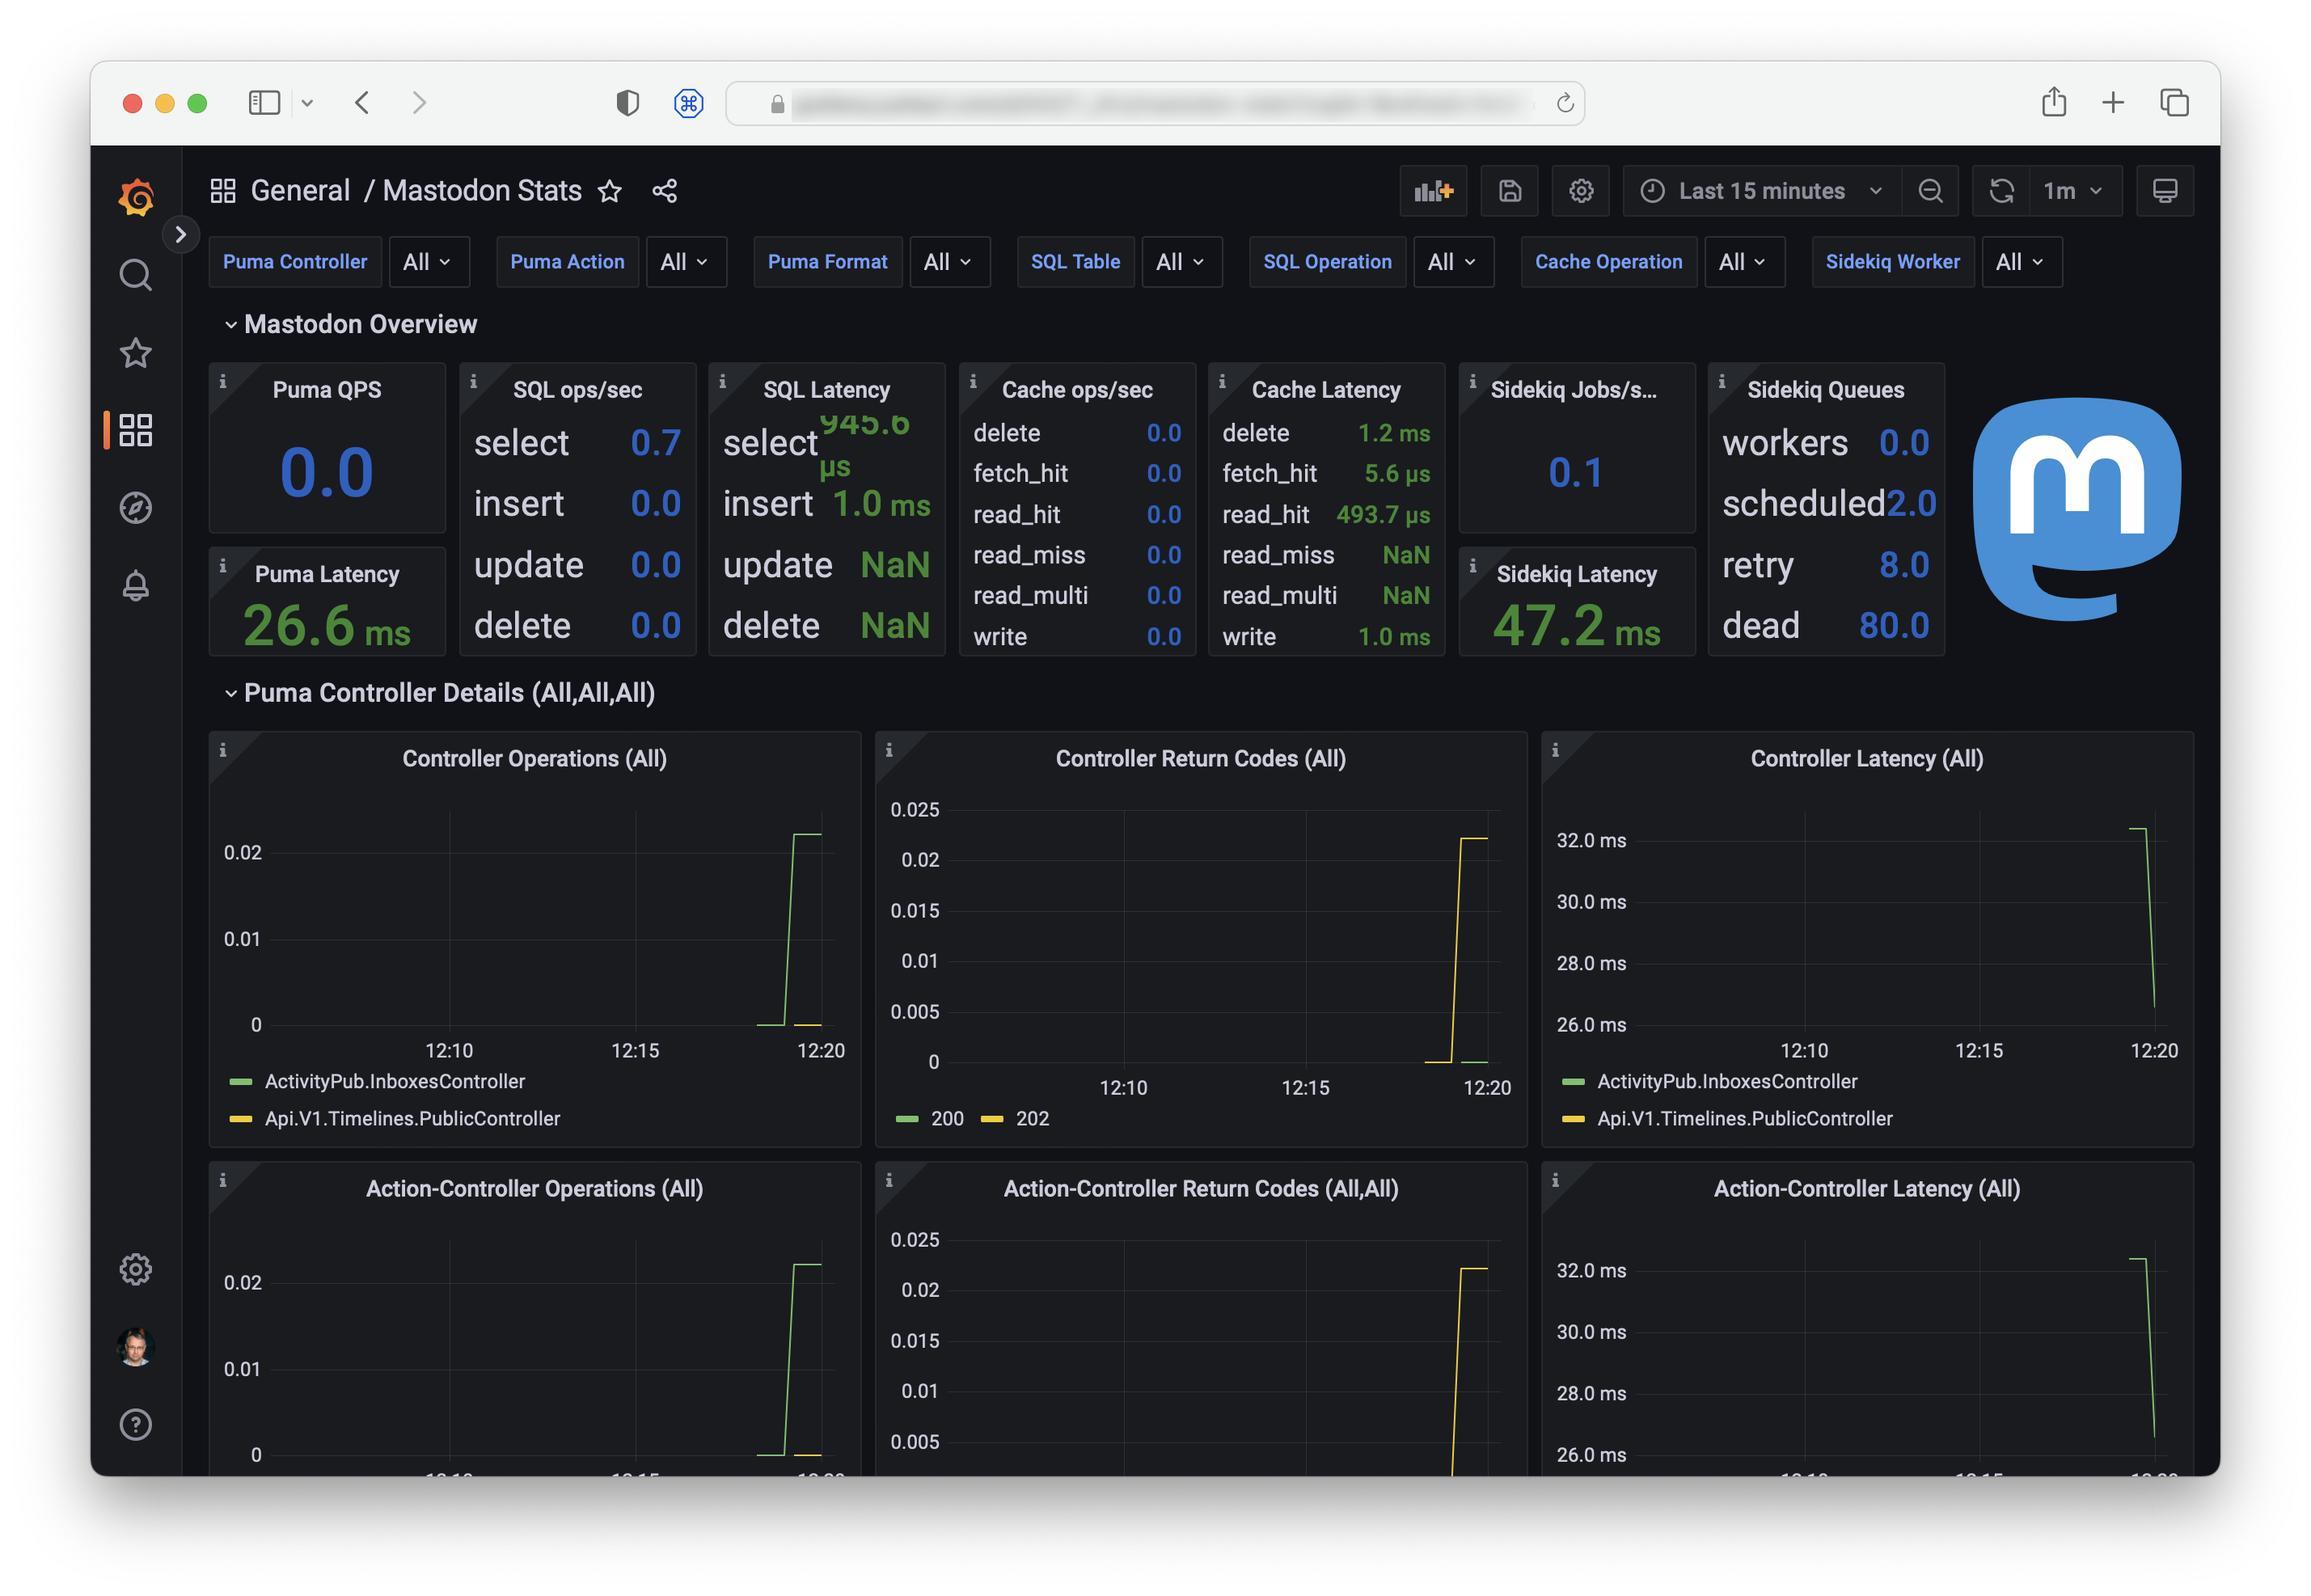
Let’s now add the Mastodon-specific dashboard that IPng Networks describes in part 3 of their Mastodon blog series.
Download a recent binary version from the package releases page.
curl -OL https://github.com/prometheus/statsd_exporter/releases/download/v0.23.0/statsd_exporter-0.23.0.linux-amd64.tar.gz
tar xzvf statsd_exporter-0.23.0.linux-amd64.tar.gz
sudo cp statsd_exporter-0.23.0.linux-amd64/statsd_exporter /usr/local/bin
Install the statsd mapping file provided by IPng Networks:
curl -OL https://ipng.ch/assets/mastodon/statsd-mapping.yaml
sudo cp statsd-mapping.yaml /etc/prometheus
Create /etc/default/statsd_exporter with this content:
ARGS="--statsd.mapping-config=/etc/prometheus/statsd-mapping.yaml"
Create statsd_exporter.service in /etc/systemd/system/ with this content:
[Unit]
Description=Statsd exporter
After=network.target

[Service]
Restart=always
User=prometheus
EnvironmentFile=/etc/default/statsd_exporter
ExecStart=/usr/local/bin/statsd_exporter $ARGS
ExecReload=/bin/kill -HUP $MAINPID
TimeoutStopSec=20s
SendSIGKILL=no

[Install]
WantedBy=multi-user.target
Add this to /etc/prometheus/prometheus.yml:
  - job_name: statsd_exporter
    static_configs:
    - targets: ['localhost:9102']
Add this to your Mastodon .env.production:
STATSD_ADDR=localhost:9125
Restart the daemons:
sudo systemctl daemon-reload
sudo systemctl start statsd_exporter
sudo systemctl restart prometheus
sudo systemctl restart mastodon-sidekiq
sudo systemctl restart mastodon-streaming
sudo systemctl restart mastodon-web
Verify that you see some output from the exporter:
$ curl http://localhost:9102/metrics

# HELP go_gc_duration_seconds A summary of the pause duration of garbage collection cycles.
# TYPE go_gc_duration_seconds summary
go_gc_duration_seconds{quantile="0"} 1.5989e-05
go_gc_duration_seconds{quantile="0.25"} 3.2811e-05
go_gc_duration_seconds{quantile="0.5"} 5.1658e-05
go_gc_duration_seconds{quantile="0.75"} 6.6586e-05
go_gc_duration_seconds{quantile="1"} 0.000104236
go_gc_duration_seconds_sum 0.000498889
go_gc_duration_seconds_count 9
…
Import the dashboard to Grafana. Dashboard ID is 17492.
Add more exporters
You can now add more exporters, such as for PostgreSQL, Redis, nginx, and ElasticSearch if you have ES enabled. I am not going to provide the details for each exporter here, but you saw the basic pattern above, and it’s the same for all exporters:
- Install the exporter software
- Set up configuration for it in /etc/default
- Set up a system service for it in /etc/systemd/system (if you install it yourself) or make sure it exists in /lib/systemd/system (if installed by package manager). Difference explained here.
- Add any other needed configuration and permissions. See the specific exporter docs. E.g for PostgreSQL, you will need to set up a special database user to read the database stats.
- Add a link to the exporter to prometheus.yml to make Prometheus aware of it
- Restart the services, check manually that the exporter is indeed exporting
- Add a dashboard to Grafana
Where to go from here
This was a naive post that only covered the basics of monitoring Mastodon with Grafana and Prometheus. You can do many more things with these systems that I did not cover, like build your own dashboards, set up alerts, monitor things across hosts etc.
In more advanced devops environments, many of the things I do here manually are automated, templatized, containerized, scripted etc. This is just a basic manual set up with one host.
For more inspiration about Mastodon monitoring (which I may further dig into myself one day and improve my own dashboards) see lots of info from Hachyderm. For example: